
Phased Array Corrosion Mapping is a quantitative way to inspect a material where oxidation or erosion has reduced its wall thickness. Corrosion is the degradation of metallic structures which can have a variety of causal factors and can display itself in many different ways. A corrosion examination procedure is to evaluate the remaining wall thickness or the presence of mid-wall anomalies in pipework, pressure vessels or any metallic structure and can be achieved from the external surface of the material under test. Since an ultrasonic path is directly reduced on a corroded part, a conventional UT beam can report one specific thickness at a time while a phased array scan can produce an array of thicknesses. Variations in material thickness due to corrosion can then be identified and graphically portrayed as an image on a screen, aiding interpretation.
The standard approach to the inspection of corrosion is to use flaw detectors, however there is a growing requirement for corrosion mapping. Independently of the methodology chosen, corrosion mapping ultimately consists of an arranged grid of data collected over a specific area. Even if at the end each data point is a wall thickness measurement, the resolution of a corrosion mapping technique is very dependent of the technology involved in the process.
An alternate NDT method also exists for Corrosion Mapping but uses Eddy Currents, this is described in the following link; Pulsed Eddy Current (PEC)

Today, instrument embedded software provides all the necessary tools to produce efficient corrosion mapping results with different level of precision (resolution) that depends on the technology used. In addition to that, PC software applications enhance that workflow by assisting the technician in planning the inspection (scan plan), analysing the data recorded and help document appropriately in a report.
Since phased array probes are generally highly damped for a sharp signal and the focussing technology itself offers more flexibility for the sensitivity, the probe selection for phased array will be more a matter of space restriction, signal resolution and coverage.
One of the great advantages of using phased array for corrosion mapping is that it is like having an array of conventional UT probes aligned with a very precise overlap, all working at the same time. So, along with frequency, the probe element size and quantity are the key drivers. The smaller the element pitch, the finer will be the resolution along this axis. Adding more elements will simply increase the total coverage capability of the probe. It is also suggested to keep a square aperture ratio as much as possible in order to create a symmetrical beam so defects always appear the same, independent of the probe orientation.

(Example of the Sonatest Wheel Probe 2)
In the context of environment, a small footprint probe will provide the user with more flexibility for constricted area scan. A larger array will offer more coverage and efficiency to scan large and unrestricted area. In order to create a precise, high resolution corrosion map, the signal has to be position encoded and it shall include a delay line that fits the thickness of the material. This can be achieved using a Wheel Probe 2 or a probe with a standard 0° irrigated wedge with a manual encoder.
How does it work?
Scan Plan
Usually, when conducting Phased Array Corrosion Mapping, the phased array scan dimensions cannot be changed during data acquisition, so it is important that each of the sections follow the main scan map. To support this planning, some instruments, for example the Sonatest Veo3, can offer 3D embedded modelling tool that helps predefine the dimensions of each section. Also, the active coverage of the probe is displayed directly on the 3D view, helping to confirm the overlap between passes. Again, all these settings can be implemented on site, directly on the instrument. A supervisor could alternatively pre-build the configuration using the UT Studio software.


Data Acquisition
During data acquisition, it is very important for the user to concentrate on the quality of its acquisition. Therefore, the useful information to display on the instrument screen while scanning are: L-SCAN, A-SCAN, Scrolling B-SCAN and a Merged SCAN (TOP or C-SCAN).

Data Analysis – On the Instrument
Immediate review on the instrument is possible. This is very useful in order to confirm the correct acquisition of data before scanning another area. Since corrosion mapping normally applies on large sections, evaluating the data set on the instrument might not be the optimal solution. Even if all the tools are available on-board a Veo3 to generate a PDF report on site, it is much more convenient to use a PC software application like UT Studio, Pipe-check or custom application (or spreadsheet) to analyse data.
Data Analysis – On PC Software
Once transferred to the PC, a VEO+ data file can be processed and analysed by the UT Studio application. This software allows creating all the views used at the time acquisition as well as many other custom views: A-scans, B-scans, C-scans, B-log (B-chart in D70), Top-view, End-view, etc. These views are all linked to one another and the user can create multiple sheets with different colour palettes, settings, gates, etc.
When performing corrosion mapping analysis, the depth and amplitude C-SCAN, as well as top views (merged or not) are the most useful. Each beam of the probe is an A-Scan that generates one pixel of the view. If data extraction gives a thickness, the colour palette will translate the number into a colour. Same for the amplitude values.
Depth mode will generally highlight more erosion and scouring defects while the amplitude mode will emphasize the corrosion and pitting. As it can be seen on the images below, the amplitude doesn’t give quantitative measurements of thickness like the depth view, however it will show more changes in surface conditions, mid-wall anomalies and/or pits due to back wall echo (BWE) drops.

What’s the End Result?
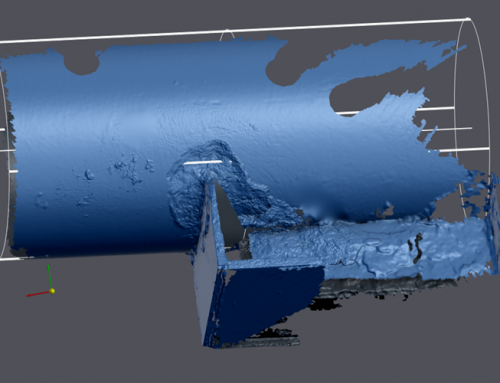
Image 1 shows a photo of a small vessel & Image 2 shows how the phased array scan data can look when analysed with the corrosion system software.
It may be hard to see on the photo, but the vessel number is actually imprinted underneath the painted coating, therefore giving a slightly higher wall thickness (when not using echo to echo mode). We scanned this section, as illustrated in the grid below, to show how the phased array corrosion system works & how the data is displayed on the software after recording.

Image No. 2 below is how the scan data appears after extraction from the phased array unit.

Image No. 3 below shows A-Scan, C-Scan & L-Scan data collected during data acquisition of a vessel shell wall. This data shows uniform wall thickness throughout the whole scan length (1m) as illustrated by the colour palette.

Image No. 4 below shows A-Scan, C-Scan & L-Scan data collected during data acquisition of another vessel shell wall. This data shows a 1.4m x 0.6m scan with moderate corrosion throughout this section of the vessel, with the wall thickness ranging from 11.9mm – 13.6mm.

What is Corrosion Monitoring?
Corrosion Monitoring is a process that evaluates and monitors equipment components, structures, process units, and facilities for signs of corrosion. Monitoring programs aim to identify certain conditions in order to extend the life and serviceability of assets while increasing safety and reducing replacement costs. Corrosion monitoring covers all types of corrosion and materials.
The key advantage to implementing corrosion monitoring is to detect early warning signs of corrosion and to determine trends and processing parameters that may induce a corrosive environment. Processing parameters that may need to be altered include temperature, pressure, pH, etc. Additionally, corrosion monitoring serves to measure the effectiveness of corrosion prevention methods in order to determine if different inspection and/or monitoring techniques should be utilised.
Why is it Important?
Corrosion is a major threat to the oil and gas, petrochemical and other process-intensive industries and is responsible for countless of dollars in damage and maintenance costs. Additionally, ageing equipment becomes more susceptible to corrosion and loses its ability to withstand harsh operating environments (e.g. high temperature and pressure). The purpose of a strong corrosion monitoring program is to improve safety, reduce maintenance and inspection costs, and maximize efficiency.
Source/Credit: https://inspectioneering.com, https://en.wikipedia.org/wiki/Corrosion, Comparison Corrosion Mapping Solutions using Phased Array and
Conventional UT Techniques – Philippe RIOUX.
Author: James Murphy, Operations Manger of IPEC Inspection Ltd.